
Technical Analysis for Avalanche (AVAX) for Upcoming week
Here’s a technical breakdown of Avalanche (AVAX) for this week, based on the latest market data and indicators as of mid-September 2025:
Current Market Snapshot for Avalanche (AVAX)
- Price Range: ~$24.50 to $25.00
- Market Cap: ~$10.4 billion
- Trading Volume: ~$750 million to $1 billion daily
- Circulating Supply: ~422 million AVAX
- Recent Monthly Gain: +8.7%
Technical Analysis for Avalanche
Key Technical Indicators
- RSI (Relative Strength Index):
Neutral zone; AVAX is neither overbought nor oversold. - MACD (Moving Average Convergence Divergence):
A bullish crossover is forming; this indicates potential upward momentum. - Moving Averages:
- 50-day SMA: ~$24.20 (price is slightly above)
- 200-day SMA: ~$28.75 (still distant, long-term resistance)
- Bollinger Bands:
The price is near the middle band; low volatility but tightening often suggests a breakout. - Money Flow Index (MFI):
There is strong buying pressure, approaching overbought territory.
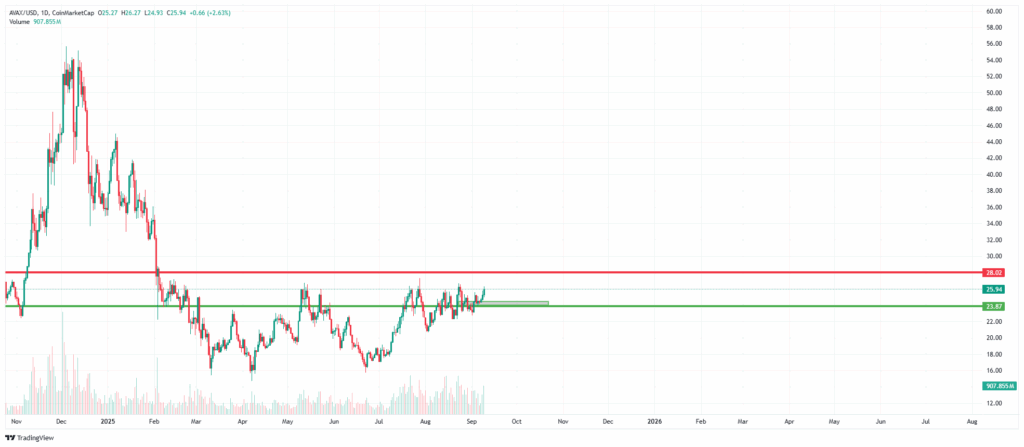
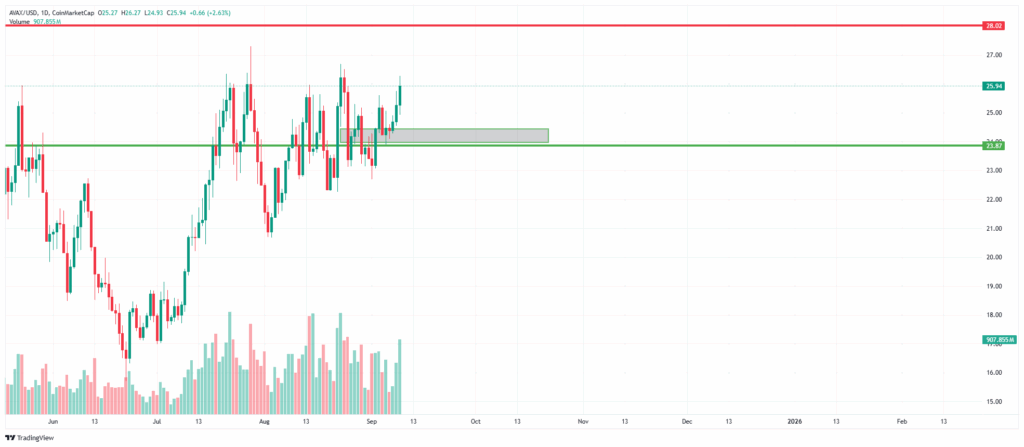
Support & Resistance Levels Avalanche (AVAX)
- Support Zone: $22.00 to $23.90
Historically absorbs selling pressure. - Resistance Zone: $27.00 to $28.00
This is a key breakout level; breaking through could open a path to $30+.
On-Chain & Ecosystem Signals Avalanche (AVAX)
- C-Chain Transactions: 35.8 million in August; this is the second-highest ever.
- RWA Market Cap: Up 58%, which signals institutional interest.
- Stablecoin Transfer Volume: There has been a sixfold surge in three months.
- Major Partnerships: Franklin Templeton, Grove Finance, Centrifuge.
Technical Analysis for Avalanche
Outlook for the Week Avalanche (AVAX)
AVAX is consolidating but is showing signs of bullish momentum. If buyers push past the $27 to $28 resistance, a rally toward $30 to $36 seems possible. However, failure to break this zone could keep AVAX trading between $24 and $26. Do your own research.